
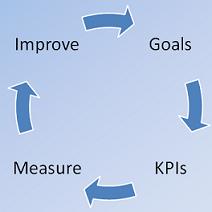
The digital analytics continuous improvement process revolves primarily around two steps – measurement and improvement – but before you can get there, you’ll need to tackle a definition of goals and selection of success metrics. What you measure should be based on what you can and will improve. As we define this process, we will also identify who needs to be involved in each step, as there are far too many cases where the process is slowed by having people in the room who are not relevant.
First, let’s add a side note – if there are things that are obvious that you need to do to improve your online experience – do them! If time permits, you should definitely find a measurement to prove the impact of these changes. Sometimes there are things that we think are obvious that don’t end up providing as much value as we thought. And while that does sound like a contradiction, analysis should not lead to paralysis. If you are going to institute this process, you should not halt work but rather integrate it into your work flow. The process itself is continuously improving.
Goals
A big part of the continuous improvement process is to measure what matters. To quote a pro who said it best:
Not everything that counts can be counted, and not everything that can be counted counts – Albert Einstein
In the improvement process, the second half is what we’re really talking about. Just because something can be measured doesn’t mean you need to pay attention to it. In fact, you can only keep an eye on so many things at one time, let alone influence them. So how do you trim down the ever increasing list of “everything that can be counted”? We’re glad you asked, because we have an answer!
Goals! Objectives! Targets! Outcomes! If you are brand new to digital analytics, you are in a prime position to define your purpose unfettered by the knowledge of “everything that can be counted”. When we go through this process with clients, we always start at goals and ban any mention of what can actually be measured. Your mind needs to be “prodigiously empty”, to quote Vitruvius in The Lego Movie.
We like to start with the question, “Why do you exist?” What is the purpose of your business and how does your online presence support that? Do you have goals handed down that are part of your overall business strategy? Do you have a bonus tied to a target? Beware: You will need to evaluate this motivation to ensure that you aren’t making adjustments just to move the needle. In fact, it is important that your target is measured by a different resource or team to ensure accountability.
The group involved in this discussion should lean toward the business side (e.g. program managers, business analysts). But in this next discussion, you’ll want to include your data platform specialists – the people who understand data collection and processing.
Key Performance Indicators
Once you have identified your goals (and you should try to keep it to three to five goals), it is time for the fun part – determining what to measure! We refer to these as the key performance indicators (KPIs). You should aim for one to three KPIs for each goal (but not more than four to eight KPIs in total). The purpose is to indicate the success of your performance across your key goals. These are the metrics that you will look frequently to as you adjust your online experience. The pressure test for each KPI is asking “Why?” If a KPI goes up, why does it matter? If it can’t pass the “why” test, then it probably isn’t really a KPI.
Measure
We are now down to the last two steps – measuring and improving. It is important to clearly define how each KPI will be measured and what platform will be the record of truth for each KPI. Your set of KPIs may likely come from different sources, and that is fine. What is important is that they are clearly defined and everyone understands how they are collected. There will always be some nuances and caveats with data collection. Make sure you understand what is and is not included when measuring a KPI.
Another important factor is ease of collection. Make sure that it does not take a team of specialists a full day to report on a single KPI. If a KPI is that important, then work out a solution for efficient data collection or determine whether a different KPI will suffice as a proxy.
Next, you will need to decide how often to report on your KPIs. If your team can’t react and execute a plan of action overnight, then you shouldn’t report on your KPIs weekly. If it takes longer than a week, then you have an entirely different issue. Hopefully it’s just that you’re biting off bigger improvement projects than your team can chew and not that your team has underlying execution issues. In most cases, a monthly reporting frequency provides sufficient time to react and measure the effect of your efforts.
Finally, you will need to decide how you will present your KPIs. The whole point of this exercise is to allow you to spring into action quickly, without spending hours mindlessly thumbing through graphs, pie charts (which I hate) and tables. I prefer the following four-quadrant approach:
Top-left: The KPI. Usually a trended month-over-month representation of the KPI. Don’t just display a static number. Provide some context – at least the percent change over the prior reporting period.
Top-right: Analysis. Provide a brief summary and explanation of the trend. Why did the KPI go up/down?
Bottom-left: Why does this matter? Provide the motivation for doing something about it if something needs to be done. Maybe it doesn’t matter at all.
Improve
Bottom-right: Action! What we’re going to do about it.
Wait! Why did we start the last section, Improve, before introducing the final quadrant? Because this is where everyone gets involved. In this approach, you can leave this fourth quadrant blank. Schedule a recurring meeting with all resources where you walk through the KPIs and fill in the fourth quadrant together. Participants should have enough time between receiving the KPI report and the discussion to do further analysis in preparation for the discussion. The point of selecting KPIs is not about throwing out data, it’s about narrowing the focus to determine which underlying data is most important. In order to understand a trend, you should be looking at underlying data in conjunction with the KPIs. This will allow you to answer the “why?”
Remember when we said you should have four to eight KPIs in total? More KPIs mean more actions to sort through; this is why you should cap it. Once you have completed the “action” section, you will need to sort these actions by feasibility and perceived effectiveness to determine which ones your team can actually tackle, and in which order. Some actions may be less than desirable because they will just take too much effort and their potential effectiveness may not be very high. Don’t think you need to act on every KPI. Focus on the actions that strike a balance between feasibility and effectiveness.
Now that you have an understating of the “improvement process” portion of the continuous improvement process, it’s important that you recognize the importance of that first word. It’s essential that the process become one that is ongoing. Fortunately it’s exciting as well – at least for data nerds like us. It’s rather fun to watch KPIs and develop strategy to improve them – especially when those strategies pay off. Constant monitoring ensures success, and with a process in place to monitor and maintain the way you improve your KPIs, success becomes measurable.